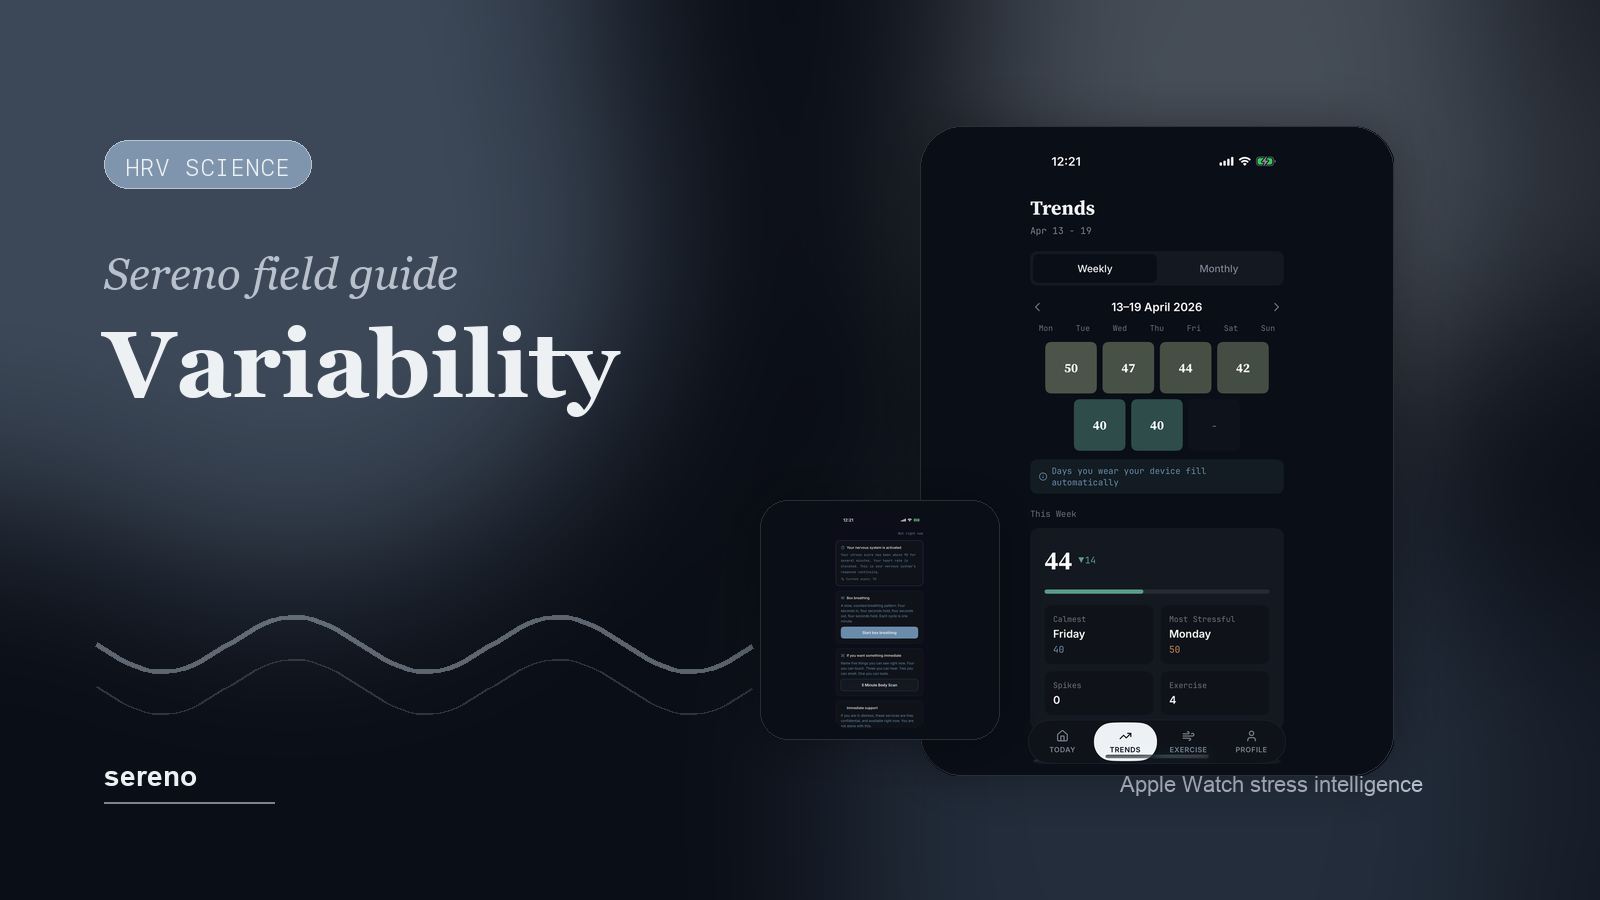
If someone asked you to describe a healthy heart, you might say it beats steadily, like a metronome. Consistent. Predictable. Reliable.
You would be wrong.
Your Heart Does Not Beat Like a Metronome
A healthy heart is actually a little bit irregular. The gap between one heartbeat and the next is never exactly the same. Sometimes it is 0.8 seconds. Then 0.85. Then 0.78. These tiny fluctuations, measured in milliseconds, are what researchers call heart rate variability, or HRV.
This might seem like noise in the signal, but it turns out to be one of the most meaningful metrics your body produces. Over the past two decades, an enormous body of peer-reviewed research has established HRV as a reliable, non-invasive window into how your autonomic nervous system is functioning at any given moment.1
The core insight is counterintuitive: more variability is generally better. A heart that can subtly speed up and slow down from beat to beat is a heart that is flexible, responsive, and well-regulated. A heart that locks into a rigid rhythm, paradoxically, is showing signs of stress, fatigue, or reduced adaptive capacity.
When we first started building Sereno, this was one of the most important concepts we had to understand deeply. Not just the theory, but the practical reality of reading HRV data from Apple Watch sensors and turning it into something genuinely useful for stress tracking. The gap between “HRV is interesting in a lab” and “HRV is actionable on your wrist” is wider than most people realize.
The Autonomic Nervous System Connection
To understand why HRV matters, you need to understand the two branches of your autonomic nervous system, the part of your nervous system that runs in the background, regulating functions you do not consciously control.
The sympathetic branch is your accelerator. It activates when you face a challenge, a threat, or a demanding situation. Heart rate goes up. Pupils dilate. Digestion slows. Resources shift toward muscles and brain. This is the “fight-or-flight” response, and it is genuinely useful. It is what gets you through a hard workout, a tense meeting, or a near-miss on the highway.
The parasympathetic branch is your brake. Mediated primarily by the vagus nerve (the longest cranial nerve in your body, running from your brainstem to your gut), it calms things back down. Heart rate decreases. Digestion resumes. Breathing deepens. This is the “rest-and-digest” state.
In a healthy person, these two systems are in constant dialogue. The vagus nerve continuously modulates heart rhythm, introducing that beat-to-beat variation we measure as HRV.2 When the parasympathetic system is active and your vagal tone is strong, your HRV tends to be higher. When the sympathetic system dominates (during stress, illness, or exhaustion), your HRV drops.
This is why researchers have called HRV a “window into the autonomic nervous system.”1 It gives you a real-time proxy for the balance between stress activation and recovery.
SDNN vs RMSSD: Which Metric Matters?
If you have ever looked at HRV data from a wearable, you have probably encountered some intimidating abbreviations. The two most common are SDNN and RMSSD, and they measure subtly different things.
SDNN stands for the standard deviation of NN intervals, with the “NN” referring to the normal-to-normal heartbeat intervals, filtered to exclude irregular beats. It captures overall variability and reflects the combined influence of both sympathetic and parasympathetic activity. A higher SDNN generally indicates better cardiovascular health and greater adaptive capacity. A comprehensive review of HRV metrics found that SDNN captures global HRV and is the most widely used measure in clinical research.1
RMSSD stands for root mean square of successive differences. Instead of looking at overall variability, it focuses on the beat-to-beat changes between consecutive heartbeats. This makes it primarily a parasympathetic measure that is especially sensitive to vagal tone and short-term regulatory shifts.
So which one should you care about?
For most practical purposes, both tell a similar story, and they tend to correlate strongly. In clinical research, SDNN is the standard for 24-hour recordings, while RMSSD is preferred for short-term readings (a few minutes) because it is less affected by slow-changing trends.1
When we built Sereno’s stress scoring system, we chose SDNN as the primary HRV metric because it captures the broadest picture of autonomic function. The engine calculates how far your current SDNN deviates from your personal baseline (not from any population average) and uses that deviation as the single strongest signal in the stress score. But we also read RMSSD as a fallback for situations where SDNN data is not available, ensuring that the system remains functional regardless of which metric your wearable provides.
What Affects Your HRV
Your HRV is not a fixed number. It fluctuates throughout the day, across weeks, and over your lifetime. Understanding what influences it helps you interpret your readings correctly instead of panicking over normal variation.
Age is the largest factor. HRV naturally declines as you get older. A 25-year-old might have an average SDNN of 60-80 ms, while a healthy 60-year-old might sit around 30-50 ms. This is why comparing your HRV to someone else’s is almost always misleading.
Fitness level has a significant positive effect. Endurance athletes typically have higher HRV than sedentary individuals, reflecting stronger vagal tone and more efficient cardiovascular regulation.
Sleep is critical. Your HRV typically rises during sleep as the parasympathetic system dominates. A bad night of sleep almost always shows up as suppressed HRV the next day, sometimes more reliably than subjective feelings of tiredness.
Alcohol suppresses HRV, often dramatically. Even moderate drinking can reduce overnight HRV by 20-30%, and the effect persists for 24-48 hours. If you have ever wondered why you feel off the day after drinking, your HRV data would tell the story clearly.
Caffeine is more nuanced than most people expect. Research has shown that caffeine consumed 6 hours before bedtime can significantly reduce sleep quality, which in turn suppresses overnight HRV.4 But the effect depends heavily on your personal tolerance. Studies of habitual coffee drinkers have found that their cardiovascular response to caffeine is substantially blunted compared to non-regular consumers.5 One person’s double espresso at 3 PM is another person’s sleep disaster.
This caffeine nuance is something we spent a lot of time on during Sereno’s development. The stress score engine actually accounts for both the time of day when caffeine is consumed and the user’s self-reported caffeine habit. An evening coffee gets weighted very differently than a morning one, and a heavy coffee drinker’s response is modeled differently than a non-drinker’s. It is a small detail, but it makes the difference between a stress score that puzzles you and one that actually matches your experience.
Illness, even subclinical, can tank your HRV before you feel symptoms. Some users have reported seeing their HRV drop a day or two before they notice a cold coming on.
HRV and Age: What to Expect Over the Decades
Age is the single most powerful predictor of HRV, yet it is the factor most often overlooked in casual conversations about heart rate variability. A comprehensive longitudinal study spanning nine decades of life found that HRV declines steadily and predictably from early adulthood onward, with the steepest drop occurring between the ages of 25 and 65.6
To put concrete numbers on it: the average SDNN for a healthy person in their twenties tends to fall somewhere between 60 and 100 ms. By the forties, that range typically shifts down to 40 and 70 ms. By the sixties and seventies, many healthy individuals sit between 20 and 50 ms. These are broad ranges, and individual variation is substantial, but the trend is consistent and well-established across populations.
The biological reason is straightforward. The vagus nerve, like every other part of your nervous system, undergoes gradual structural changes with aging. Nerve conduction slows. The density of parasympathetic receptors in the heart decreases. The sinoatrial node, the heart’s natural pacemaker, becomes less responsive to vagal input. None of this is pathological. It is simply the natural trajectory of a biological system over time.
What makes this important for anyone tracking their HRV is that the absolute number matters far less than the trend relative to your own baseline. A 60-year-old with an SDNN of 35 ms might be in excellent cardiovascular health for their age. A 25-year-old with the same reading would warrant investigation. This is precisely why Sereno never shows you a population average or a target number. Your baseline is calculated from your own recent data, and deviations are measured against that personal reference point.
Gender also plays a role, though a smaller one than age. Research has generally found that premenopausal women tend to have slightly lower SDNN than men of the same age, with the gap narrowing after menopause.6 Hormonal fluctuations across the menstrual cycle can also introduce short-term HRV variability that has nothing to do with stress. This is another reason why personal baselines, rather than fixed thresholds, are essential for accurate interpretation.
One encouraging finding from the research is that the age-related decline in HRV, while inevitable, is modifiable. Regular physical activity, consistent sleep, and effective stress management can all slow the rate of decline. You cannot reverse aging, but you can influence the slope of the curve.
Common HRV Myths Debunked
HRV has become a mainstream wellness metric, which means it has also accumulated a layer of myths and misconceptions. Here are the most persistent ones, and what the evidence actually says.
Myth: Higher HRV is always better. This is the most widespread simplification, and it is mostly true but not entirely. Very high HRV can, in rare cases, indicate certain cardiac arrhythmias or autonomic dysfunction. In the vast majority of healthy people, higher HRV does correlate with better cardiovascular fitness and autonomic flexibility. But chasing the highest possible number, especially through artificial manipulation like hyperventilation or cold exposure right before measurement, misses the point. What matters is your resting HRV trend over time in natural conditions.
Myth: You can meaningfully compare your HRV with someone else’s. As we have discussed, individual variation is enormous. Age, genetics, fitness level, medication use, body composition, and even resting heart rate all influence your baseline HRV. Two people with identical stress levels and identical health can have HRV readings that differ by a factor of three. Social media posts celebrating high HRV numbers are about as informative as celebrating being tall. It reflects your constitution more than your choices.
Myth: A single HRV reading tells you something important. HRV is inherently noisy. A reading taken while you are sitting at your desk can shift by 10 to 15 ms within a few minutes based on nothing more than a change in posture, a deep breath, or a brief emotional reaction. Individual readings are snapshots contaminated by dozens of transient variables. The signal emerges from the trend across days and weeks, not from any single measurement. Sereno’s approach of comparing against a rolling personal baseline is specifically designed to extract the trend from the noise.
Myth: Low HRV always means you are stressed. Low HRV can mean many things. Yes, stress is one common cause. But so is physical fatigue after intense exercise, the natural circadian dip in the afternoon, dehydration, certain medications (beta-blockers significantly lower HRV), and illness. Interpreting a low reading requires context. Was it taken during a workout? After a night of poor sleep? Following a hard training day? The number alone cannot tell you the cause.
Myth: Meditation and breathing exercises permanently raise your HRV. Regular breathing exercises and meditation do improve resting HRV over time, and the evidence for this is solid. But the effect is more modest than the wellness industry sometimes implies. A meta-analysis of exercise training and HRV found that improvements in resting SDNN from regular training typically range from 10 to 20%, which is meaningful but not transformative.7 The benefit is real, but it accumulates gradually over weeks and months of consistent practice, not from a single session.
Myth: You need to measure HRV at the exact same time every day for it to be useful. Consistency does improve comparability, and morning measurements are the gold standard for baseline tracking. But modern wearables capture HRV continuously, and sophisticated analysis (like what Sereno performs) can account for time-of-day variation in the model. If your wearable collects overnight data, you already have the most consistent measurement window without any effort on your part.
How to Improve Your HRV
If you have been tracking your HRV and want to see it trend upward over time, the good news is that several interventions have robust evidence behind them. The less glamorous news is that most of them are things you already know you should be doing.
Consistent aerobic exercise is the most powerful lever. A meta-analysis of 19 randomized controlled trials found that aerobic exercise training significantly improves HRV, with the effect being most pronounced in previously sedentary individuals.7 You do not need to train like an athlete. Regular moderate-intensity exercise (brisk walking, cycling, swimming) for 30 to 45 minutes, three to five times per week, is sufficient to produce measurable improvements within 8 to 12 weeks. The mechanism is clear: regular cardiovascular training strengthens vagal tone, the parasympathetic influence on your heart that drives the variability in HRV.8
Sleep quality matters more than sleep quantity. Seven hours of deep, uninterrupted sleep will produce better overnight HRV than nine hours of fragmented, light sleep. The practices that improve sleep quality are well-established: consistent sleep and wake times, a cool bedroom, limited caffeine after early afternoon, reduced screen exposure in the hour before bed, and avoidance of heavy meals and alcohol close to bedtime. If you want one change that will most reliably improve your HRV, fixing your sleep is almost always the right first step.
Breathing exercises produce both acute and chronic benefits. A single session of slow, controlled breathing at roughly six breaths per minute produces an immediate, measurable increase in HRV. With regular daily practice (even as little as five minutes), resting HRV gradually improves over weeks as your vagal tone strengthens. Coherence breathing (5.5 seconds in, 5.5 seconds out) is particularly effective for HRV training because it targets the resonance frequency where most people’s HRV response is strongest.
Reducing alcohol consumption has a disproportionately large effect. Even moderate drinking suppresses HRV for 24 to 48 hours. If you currently drink several times per week and you reduce that to once a week or less, your weekly average HRV will almost certainly improve noticeably. This is one of the fastest visible changes people see in their data.
Stress management through whatever works for you. Chronic psychological stress suppresses HRV through sustained sympathetic activation and elevated cortisol. Any intervention that genuinely reduces your experienced stress, whether it is therapy, time in nature, social connection, journaling, or simply better boundaries around work, will eventually show up in your HRV data. The specific method matters less than the consistency of the practice.
Hydration is an underappreciated factor. Dehydration reduces blood volume, which forces your heart to work harder to maintain circulation. This increased cardiac workload shows up as reduced HRV. Simply staying well-hydrated throughout the day can prevent unnecessary HRV dips that have nothing to do with stress.
Time and patience are essential. HRV improvement is gradual. Expect to see meaningful trend changes over weeks and months, not days. This is why Sereno tracks your rolling baseline and highlights long-term trends rather than emphasizing daily fluctuations. A rising average over two months is far more informative than any single day’s reading.
How Sereno Uses HRV
Most wearable apps show you your HRV as a raw number, maybe a daily average, maybe a graph over time. That is a start, but it is not enough to be genuinely useful. A raw HRV of 42 ms tells you almost nothing without context.
Sereno’s approach is fundamentally different in three ways:
First, everything is personal. The stress scoring engine compares your current HRV against your own personal baseline, a rolling statistical model of your recent patterns. If your typical SDNN is 45 ms and today it drops to 32 ms, that is a significant deviation. If someone else’s typical SDNN is 80 ms and theirs drops to 65 ms, that might be equally significant for them, even though their absolute number is still higher than yours. Population averages are statistically interesting but individually useless.
Second, HRV does not operate alone. Your HRV reading is one of over 20 signals in Sereno’s stress score, combined with heart rate trends, sleep quality, activity levels, time of day, calendar events, and even environmental factors like noise levels. A low HRV during a hard run means something completely different than a low HRV while sitting at your desk at 2 PM. The scoring engine uses a multi-signal architecture with distinct weighting tiers: primary biometric signals (including but not limited to HRV) carry the most weight, contextual signals adjust the interpretation, and lifestyle modulators fine-tune the output.
Third, the math is designed for nuance, not drama. Raw stress indicators are passed through a sigmoid normalization function that maps them to a 0-100 scale. This prevents extreme readings from producing absurd scores and ensures that the output is stable enough to be useful day-to-day while still being sensitive enough to catch real changes. The goal was never to alarm people, but to make the invisible visible, so you can notice patterns and make better decisions.
A meta-analysis of 37 studies confirmed that reduced HRV is consistently associated with higher perceived stress across diverse populations, validating the core premise of using HRV as a stress indicator.3
Reading Your Numbers
The most common mistake people make with HRV data is reading too much into individual measurements. A single HRV reading is a snapshot, influenced by when you measured it, what you were doing, what you ate, and dozens of other transient factors. It is the trend that matters.
Here is how to think about it practically:
Look at weekly averages, not daily numbers. A single bad night or stressful day can drop your HRV temporarily. If it bounces back within a day or two, your system is resilient and recovering normally. It is sustained downward trends, over a week or more, that deserve attention.
Morning measurements are most reliable. Your first waking HRV, before caffeine, exercise, or stress, provides the most consistent baseline for comparison. Many wearables automatically capture overnight or morning HRV for this reason.
Context changes everything. An HRV of 35 ms while running is completely expected. An HRV of 35 ms while resting on the couch in the evening might indicate accumulated stress, poor recovery from the previous night, or the early stages of an illness. The number means nothing without the context.
Improvement is personal. If your average HRV has gradually increased from 38 to 44 ms over two months of better sleep habits and regular exercise, that is a meaningful improvement in your autonomic health, regardless of where it falls on any population chart.
Do not compare with others. This cannot be said enough. HRV is deeply individual. Genetics, age, fitness history, medication, and dozens of other factors make cross-person comparison meaningless. The only meaningful comparison is you versus your own recent baseline.
When we designed Sereno’s reporting, we deliberately avoided showing population averages or percentile rankings. The only reference point is you: your baseline, your trends, your patterns. Because that is the only comparison that actually helps you make better decisions about your health.
References
- Shaffer F, Ginsberg JP. An Overview of Heart Rate Variability Metrics and Norms. Front Public Health. 2017;5:258. PMID: 29034226
- Thayer JF, Lane RD. The role of vagal function in the risk for cardiovascular disease and mortality. Biol Psychol. 2007;74(2):224-242. PMID: 17182165
- Kim HG, et al. Stress and Heart Rate Variability: A Meta-Analysis and Review of the Literature. Psychiatry Investig. 2018;15(3):235-245. PMID: 29486547
- Drake C, et al. Caffeine effects on sleep taken 0, 3, or 6 hours before going to bed. J Clin Sleep Med. 2013;9(11):1195-1200. PMID: 24235903
- Zimmermann-Viehoff F, et al. Short-term effects of espresso coffee on heart rate variability and blood pressure in habitual and non-habitual coffee consumers. Eur J Appl Physiol. 2016;116(7):1345-1352. PMID: 27236814
- Umetani K, et al. Twenty-four hour time domain heart rate variability and heart rate: relations to age and gender over nine decades. J Am Coll Cardiol. 1998;31(3):593-601. PMID: 9502641
- Sandercock GR, Bromley PD, Brodie DA. Effects of exercise on heart rate variability: inferences from meta-analysis. Med Sci Sports Exerc. 2005;37(3):433-439. PMID: 15741842
- Routledge FS, et al. Improvements in heart rate variability with exercise therapy. Can J Cardiol. 2010;26(6):303-312. PMID: 20548976
References
- Shaffer F, Ginsberg JP. An Overview of Heart Rate Variability Metrics and Norms. Front Public Health. 2017;5:258. [PMID: 29034226]
- Thayer JF, Lane RD. The role of vagal function in the risk for cardiovascular disease and mortality. Biol Psychol. 2007;74(2):224-242. [PMID: 17182165]
- Kim HG, et al. Stress and Heart Rate Variability: A Meta-Analysis and Review of the Literature. Psychiatry Investig. 2018;15(3):235-245. [PMID: 29486547]
- Drake C, et al. Caffeine effects on sleep taken 0, 3, or 6 hours before going to bed. J Clin Sleep Med. 2013;9(11):1195-1200. [PMID: 24235903]
- Zimmermann-Viehoff F, et al. Short-term effects of espresso coffee on heart rate variability and blood pressure in habitual and non-habitual coffee consumers. Eur J Appl Physiol. 2016;116(7):1345-1352. [PMID: 27236814]
- Umetani K, et al. Twenty-four hour time domain heart rate variability and heart rate: relations to age and gender over nine decades. J Am Coll Cardiol. 1998;31(3):593-601. [PMID: 9502641]
- Sandercock GR, Bromley PD, Brodie DA. Effects of exercise on heart rate variability: inferences from meta-analysis. Med Sci Sports Exerc. 2005;37(3):433-439. [PMID: 15741842]
- Routledge FS, et al. Improvements in heart rate variability with exercise therapy. Can J Cardiol. 2010;26(6):303-312. [PMID: 20548976]

Sereno Team
Sereno is a stress management app that combines biometric data, behavior patterns, and context to help you understand and manage stress.
More from Sereno Team